US State COVID-19 Report Card: December Update
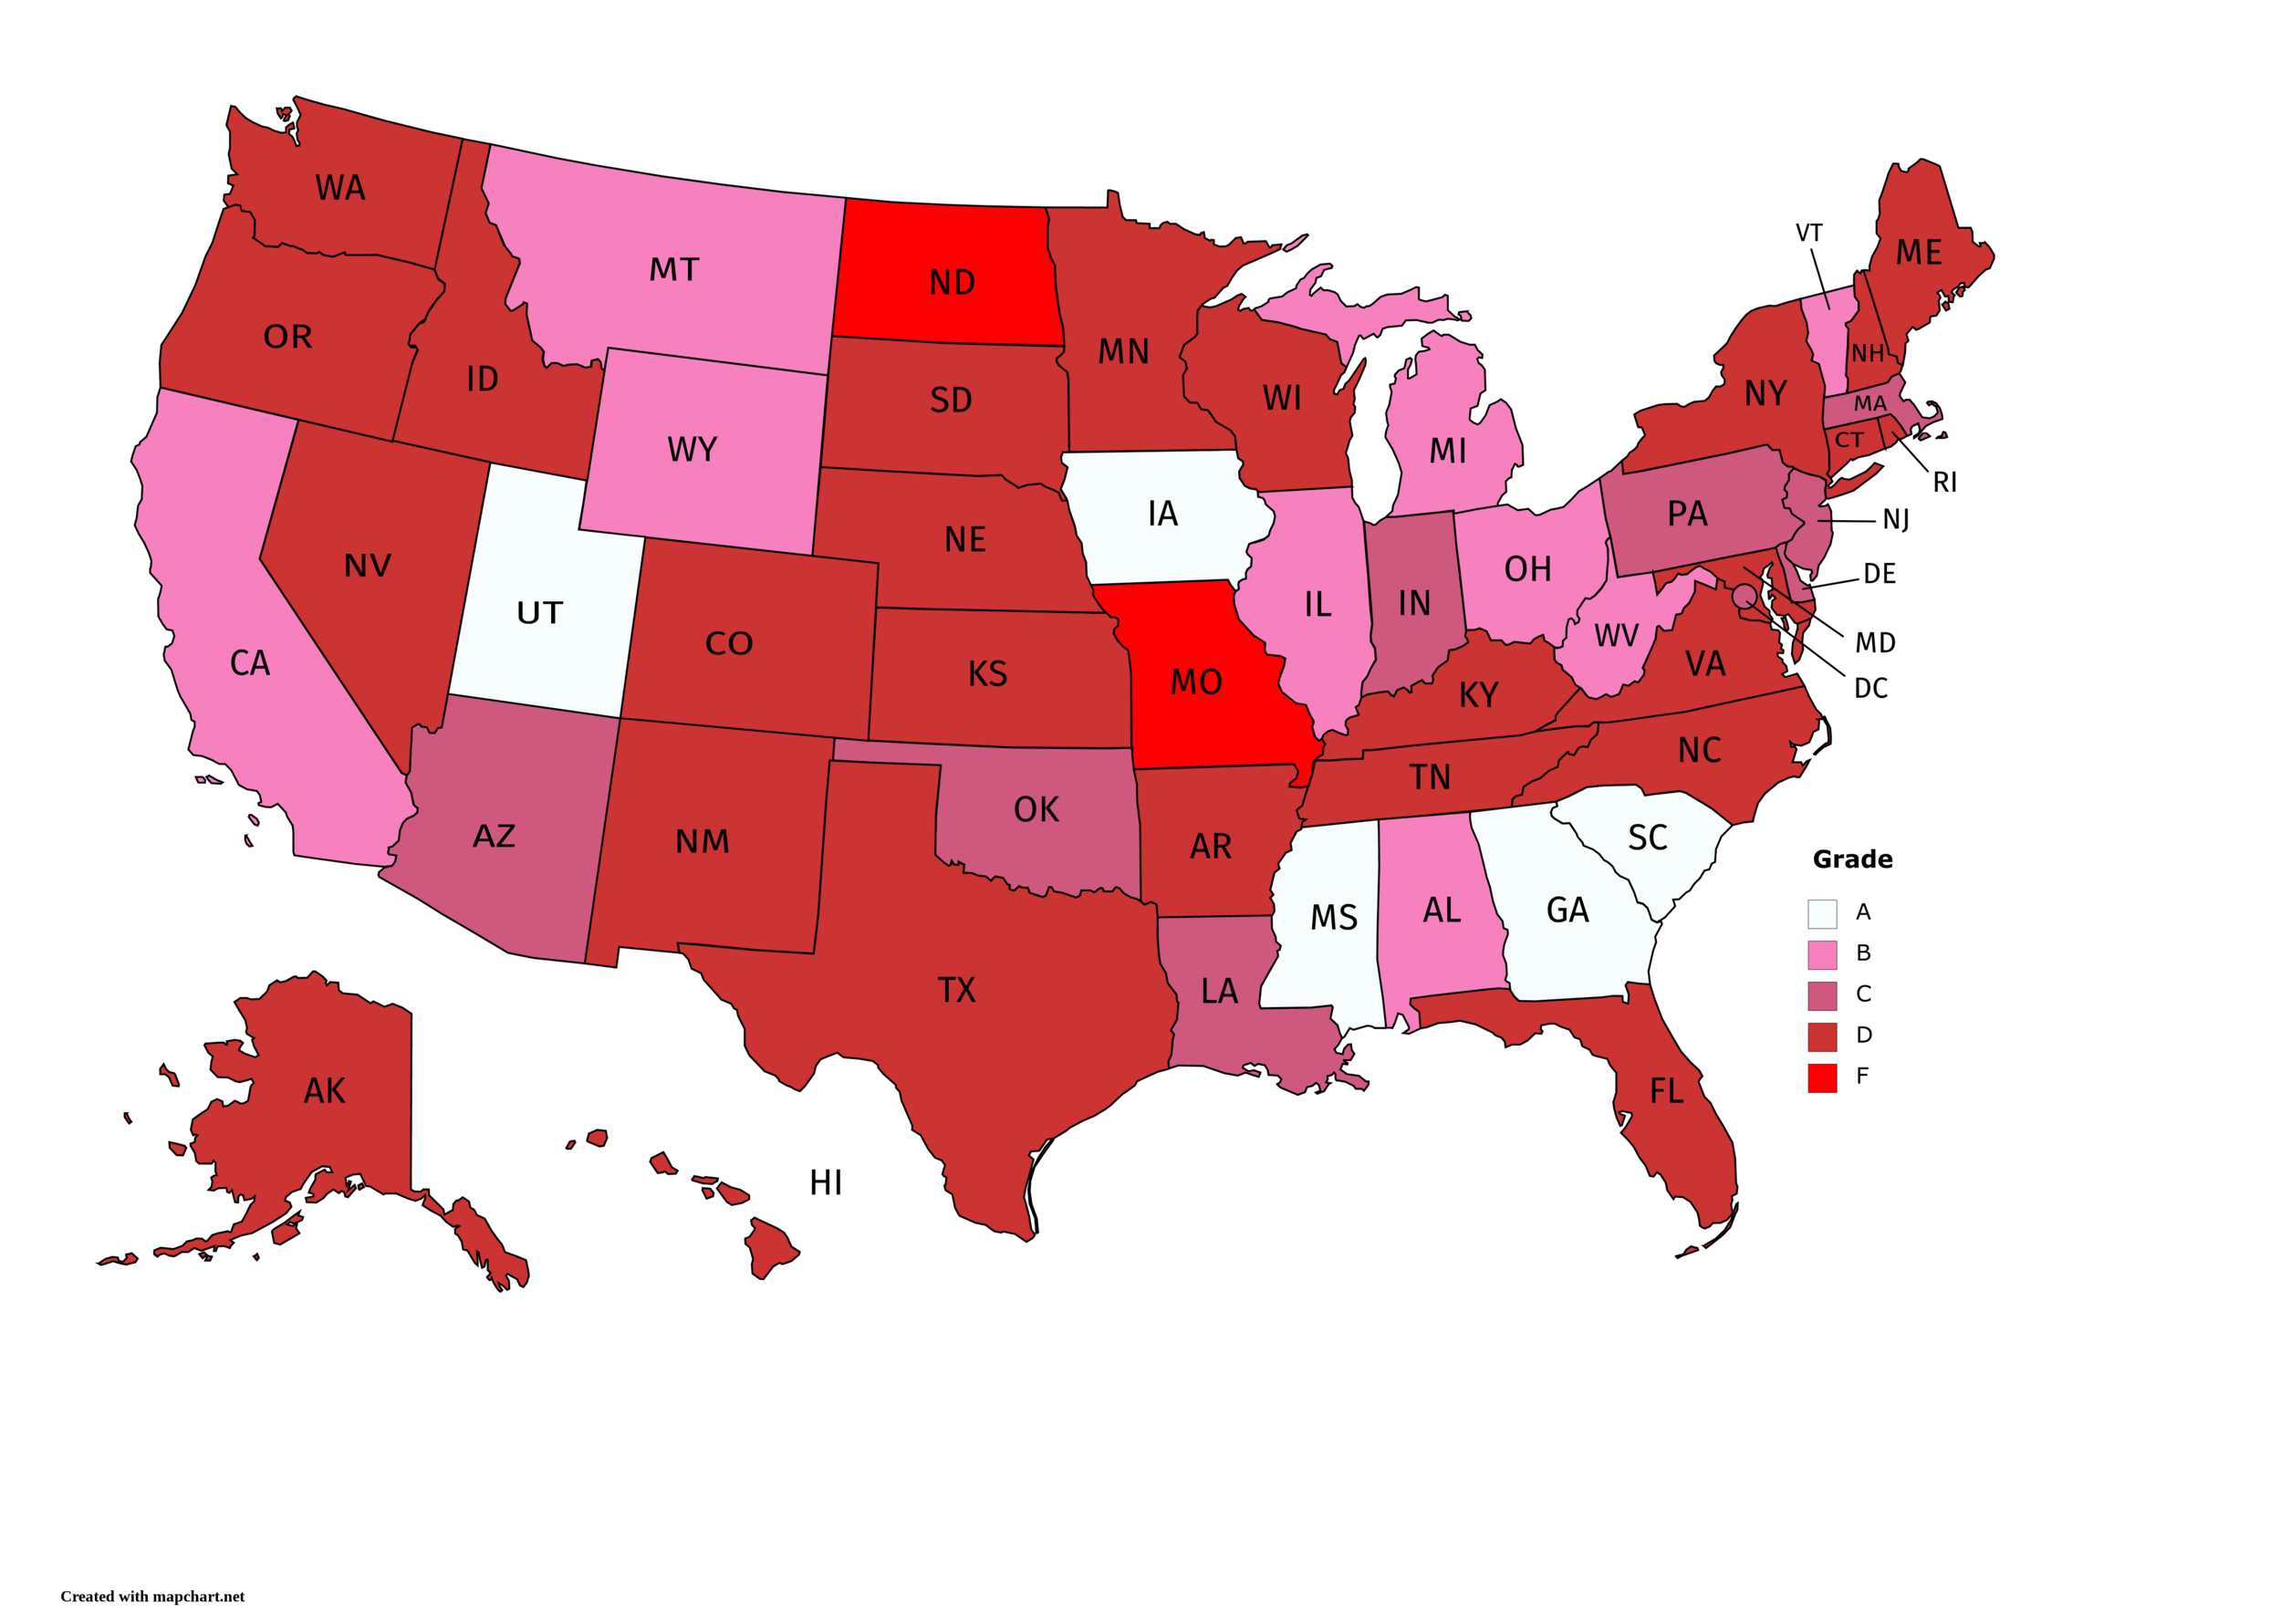
Map current as of 1/6/21
Author: MIMI TARRANT
Following the initial release of the GenderSci Lab’s Health Affairs Blog, Socially Relevant Variables in US State COVID-19 Surveillance Reporting: A Report Card, at the end of June, the lab has continued to track changes in state reporting of socially relevant variables for COVID-19 cases and fatalities. Data availability is becoming increasingly critical as many states experience a third wave of infections. By monitoring the comprehensiveness of COVID-19 data reporting across the US, we are continuing to build a picture of what data are available, and where this data can be found. Only once socially relevant variables and their interactions are analyzed, can COVID outcomes and their disparities be placed within their social context, as highlighted in our June Report Card blog post. It is of paramount importance that states continue to be held to a high standard of accountability for their data reporting.
The full data tables for this Report Card, and prior versions going back to April, are hosted on our US State COVID-19 Report Card page. Data will continue to be updated bimonthly, with primary data hosting on the site and a highlights blog emphasizing important shifts. Previous month’s highlights blogs are available below this post.
The December 2020 Report Card grades states on their reporting of socially relevant variables for COVID-19 cases and fatalities. Since our last scorecard in September 2020, the average state score has increased, yet progress has been minimal.
With an increase in average state score from 6.65 in September to 6.78 in December, the average grade for states remains at a failing D grade. The average grade has remained at a D grade since we started reporting in June, as few advances have been made in the quality of state-level data reporting.
Despite overall minimal progress, some states have seen a notable improvement in their individual scores since our last Report Card: for instance, both Montana and New Mexico saw their scores increase by 3/10 points. Montana has begun to report gender/sex, race/ethnicity and comorbidities for fatalities, taking its score from a failing D grade to a B grade. New Mexico has begun to report age, gender/sex and race/ethnicity for fatalities. However, as New Mexico only reports 6 variables in total, it still scores a failing D grade (to score a C, a state must report at least 7 variables).
Alabama also saw its score increase by 2 points, as it now reports data on comorbidities for fatalities as well as interactions among comorbidities and age for fatalities. Finally, South Carolina saw its score increase by 1 after it began reporting interactions between age and race for fatalities. This now makes South Carolina one of only five states to achieve an A grade in our Report Card.
The only state that saw a decrease in score was South Dakota, which no longer reports interactions among variables for either cases or fatalities. South Dakota now scores a failing D grade. This is of particular concern given the importance of analyzing interactions among variables to provide a more accurate understanding of an individual’s risk, as highlighted by the GenderSci’s Health Affairs Blog.
Fatality variables were the most likely to see an increase in reporting since September; all 50 states and Washington D.C. now report age data for fatalities, while North Dakota is the only state to not report the race/ethnicity of fatalities.
This December update shows that some states have been able to adapt and improve their data reporting since September. However, progress is slow. We hope that the publication of this report card will highlight areas for critical improvement, and will encourage states to continue to strive for comprehensive reporting of socially relevant variables.
Highlights from December’s Report Card
From September to December, the average state score increased from 6.65 (D grade) to 6.78 (D grade) on a scale of 0-10.
Both Montana and New Mexico saw score increases of 3. This takes Montana’s score to a B grade, and New Mexico’s score to a D grade.
Alabama and South Carolina both saw their scores increase, by 2 points and 1 point respectively. Alabama now reports comorbidities and interactions among data for fatalities, moving up to a B grade. South Carolina has also begun reporting interactions among data for fatalities, and now scores an A grade.
South Dakota was the only state to see a decrease in score due to its no longer reporting interactions among data for cases or fatalities.
All 50 states plus the District of Columbia now report age for fatalities.

Source: Authors’ analysis of State Health Department websites, as described in Boulicault et al. 2020
Prior Report Card blog posts
Original June 2020 Report Card and Health Affairs Blog Post
July 2020 Report Card Highlights
RECOMMENDED CITATION
Tarrant, M. “US State COVID-19 Report Card: December Update ” GenderSci Blog, January 8, 2021. https://www.genderscilab.org/blog/us-state-covid-19-report-card-december
CONTACT
For media and other inquiries concerning the Data Report Card or questions about the GenderSci Lab COVID Project, please contact us at
genderscilab@fas.harvard.edu.
STATEMENT OF INTELLECTUAL LABOR
Tarrant wrote the blog post and highlights. Boulicault provided edits. D’Souza, Tarrant, and Jillson collected and validated the data.