Gender Equality Paradox Monkey Business: Or, How to Tell Spurious Causal Stories about Nation-Level Achievement by Women in STEM
Authors: Sarah S. Richardson and Joe Bruch
Today, Psychological Science published a peer-reviewed Commentary authored by the GenderSci Lab, responding to the article, “The Gender-Equality Paradox in Science, Technology, Engineering, and Mathematics Education,” by Gijsbert Stoet and David Geary, published in 2018. In our Commentary, we argue that this Stoet and Geary’s “Gender Equality Paradox” offers an example of the spurious use of global gender equality index data and the selective use of discordant and contrived measures of women’s STEM achievement and a subset of countries to tell a particular story. Additionally, the GenderSci Lab could not replicate Stoet and Geary’s findings, forcing the publication of a Corrigendum to Stoet and Geary’s study.
This post is an explainer and supplement to our Psychological Science Commentary. We discuss five key problems with data and inferences that we identified in Stoet and Geary’s study. In places this is a wonky read, so here’s a data-lite summary of the issues:
Issues with replicating the findings
Spurious correlation
Lack of longitudinal design
Inadequate robustness of the finding to changes in data, measures, and assumptions
The ecological fallacy
1. Half the story, with a twist: What country comparisons of women’s and men’s achievements in STEM really tell us
Stoet and Geary use country-level tertiary degree statistics to compare women’s achievement in STEM around the world. The best source for these is UNESCO, which maintains comprehensive educational statistics. Tertiary degrees - anything above a high school degree - are a fine measure of interest in a field. It takes both skills and persistence to achieve a tertiary degree, and they portend the possibility of a future career in the field.
It’s important to note the limitations of UNESCO’s numbers, however. Tertiary degrees by sex are self-reported by each country and reflect only degrees awarded within the nation’s boundaries. Tertiary education systems vary substantially across the globe. Some are largely technical institutions, others have broad liberal arts offerings. In some countries, a majority of citizens earn a tertiary degree. In others, only a tiny elite attends such institutions. If there is variation in which fields count as “STEM” across different countries and university systems, this could be consequential for the interpretation of comparisons across countries. Health fields, for example, are largely feminized the world over, but medical and nursing degrees are not generally counted as STEM fields in the US. They may be elsewhere. Additionally, in many countries there is significant “outflow” to other countries for higher education. Most STEM degrees globally are earned in the US, Canada, and Europe. If there is a sex difference in who leaves to obtain a degree abroad, this will alter gender statistics in STEM in the host and home country.
UNESCO reports two kinds of data on completed STEM tertiary degrees for men and women across the globe: (1) percentage of women among STEM graduates and (2) percentage of STEM graduates among all women graduates. In their 2018 paper, Stoet and Geary claimed that their numbers represented the first of these, “the percentage of women among STEM graduates” (pg. 4) — meaning that if 30% of STEM graduates are women, 70% will be men. And indeed, this is the most common statistic used in global comparisons of women’s achievement at the tertiary level.
Attempting to reproduce their findings, the GenderSci Lab tried to match Stoet and Geary's numbers to the UNESCO data and could not. We reported this to Psychological Science, and Stoet and Geary were required to issue a Corrigendum. It was soon revealed that Stoet and Geary used neither of the UNESCO measures. Instead, they produced their own novel metric, which they now termed a “propensity measure.” They did this by adding together the percentage distribution of all female graduates who received a degree in STEM to the percentage of all male graduates who received a degree in STEM, making this number their denominator, and then taking the female percentage from this.
A first attempt at replication
To see what this manipulation does to women-in-STEM statistics, take the example of Algeria. In 2015, Algeria had 287,914 tertiary graduates, 62.7% of whom were female. Of the 180,554 female graduates, 26.66% (n=48,135) obtained a degree in STEM. Of the male graduates, 38.89% (n=41,752) earned STEM degrees. Thus, for Algeria, the percentage of women among STEM graduates was 53.55%. Stoet and Geary, however, added the percentages of female and male STEM graduates (26.66% and 38.89%) to make their denominator, and therefore reported a very different female STEM degree rate of 40.7%. Stoet and Geary’s resulting numbers are lower than the percentage of women among STEM graduates across all nations by an average of 8.84%.
This gives us three ways of measuring women’s tertiary-level achievement in STEM at the nation level:
Percentage of women among STEM graduates
Stoet and Geary’s “Propensity Ratio"
Percentage of STEM graduates among all women graduates
We undertook a comparison of how the 52 countries that Stoet and Geary included in their study change rank depending on the measures used. It turns out that there are massive differences.
But before we turn to that, there is one more bit of monkey business to attend to: even after their Corrigendum clarified how they calculated their women-in-STEM numbers, we still could not reproduce Stoet and Geary’s “Propensity Ratio” using publicly available UNESCO data. Table 1, below, shows a large discrepancy for Luxembourg and several countries for which Stoet and Geary reported data, but UNESCO did not. (Stoet and Geary claim that the used 2012-2015 data, which may explain how they filled missing 2015 data points, but we could not determine their method for incorporating data from other years, and they would not answer our queries about this.)
Click on Table 1. link below to see table
Now that we’ve cleared that up, a second attempt at replication
Let’s look now at how country ranking compares depending on the measures used. Given the above, we now have four ways of measuring women’s tertiary-level achievement in STEM at the nation level:
Percentage of women among STEM graduates
Stoet and Geary’s “Propensity Ratio” numbers as reported in their 2018 paper
The Propensity Ratio as recalculated using publicly available UNESCO data by Richardson et al.
Percentage of STEM graduates among all women graduates
Table 2 shows the comparative country rankings for 19 countries that showed significant variation depending on the measure used. Ranking is out of 46 matched countries for which there are 2015 UNESCO data for women's tertiary degrees in STEM. This represents 46 out of the 52 countries included in Stoet and Geary's (2018) country cohort.
First, we compared Stoet and Geary’s reported numbers (A) with our replication of their “propensity ratio” using available data (B). As column (C) shows, our results differed substantially on 6 countries: Ireland, South Korea, Malta, Poland, Luxembourg, and Denmark.
Even more striking are the shifts observed in column (F), when country rank by percentage of tertiary degrees in STEM is compared to Stoet and Geary’s country rankings. Fifteen countries shift 10 spots or more in the rankings in this comparison.
Click on Table 2. link below to see table
Now rank has shifted, so what?
While we maintain that Stoet and Geary’s propensity ratio is not a generally-accepted measure of women’s achievement in science and has little mathematical meaning, it is not our aim to argue that one of these measures is better than the other. None of these changes alters the finding of a negative correlation between Global Gender Gap index scores and female tertiary degrees in STEM, although both the UNESCO percentage of women among STEM graduates and our recalculation decrease the strength of that correlation. Rather, our aim is to show that each offer a different dimension of the overall picture of women’s tertiary degree achievement in STEM. These changes in country rankings are important because they invite alternative hypotheses regarding the correlation between GGGI and women’s achievement in STEM to that proposed by Stoet and Geary (Table 3).

Many countries do far better for women in STEM on the percent measure than the ratio measure. Countries like Poland and Estonia, which bestow high numbers of tertiary degrees to women overall (both countries awarded 66 percent of their 4-year bachelor’s degrees to women in 2015), tend to move up the rankings for percent. The United States and Sweden both rank high on GGGI and perform poorly (33rd and 38th) using the ratio measure, but are in the top half of the field (22nd and 21st) by percent measure. These rank shifts themselves are interesting - perhaps countries cluster in terms of how many women receive tertiary degrees and of those, how many are in STEM.
What we observe is that there is huge variation in the gender gap in women’s and men’s tertiary degrees, no matter how it is measured, across countries. These variations do not conform to simple patterns, suggesting that the question of women’s and men’s inequalities in STEM fields represents a distinct and rich domain of gender inequality that is not easily represented along a single dimension and with a single measure, as Stoet and Geary attempt to do. Even were we to agree on the right set of numerical indicators of women’s STEM achievement, however, the inferences that comprise the “Gender Equality Paradox” hypothesis still have substantial problems.
2. Correlation doesn’t equal causation
First, it is easy to see that the caution that “correlation doesn’t imply causation” plainly characterizes Stoet and Geary’s approach. The authors took two measures, ran a correlation, and then made an implicit causal claim relating sex differences in STEM and gender equity without much justification and little consideration of theory.
To see how easy it is to generate ridiculous correlations between women in STEM statistics and other trends, we engaged the services of Tyler Vigen, author of the book Spurious Correlations. Vigen maintains a website of the same name with a widget allowing users to generate many kinds of correlations. The GenderSci Lab provided Vigen with US data on women in STEM, and this produced a wealth of extremely strong correlations (all above .95, far stronger than the modest .4 correlation reported by Stoet and Geary). Among the findings:
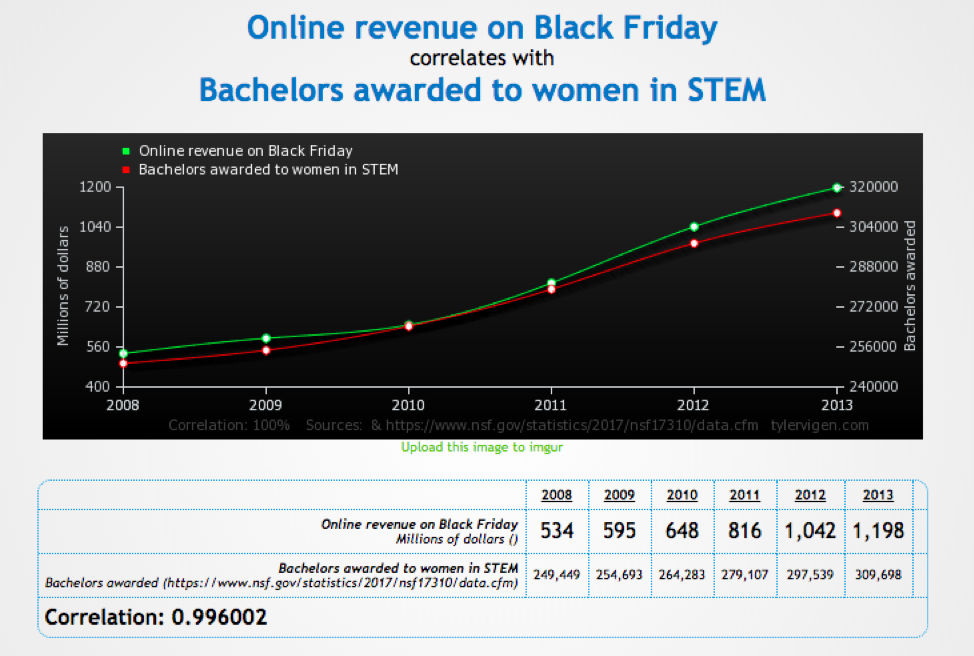
Image used with permission of Tyler Vigen

Image used with permission of Tyler Vigen
Can you think of a causal explanation for these absurd correlations? The GenderSci Lab had some fun with this, coming up with some hilarious explanations. For instance, perhaps rising cost of admission to spectator sports (US) reflects men reclaiming masculine spaces as women infringe on STEM. Maybe Black Friday spending is driven by women compensating for the gender dysphoria they feel in getting STEM degrees through retail therapy. Or, perhaps more high-salary STEM positions for women translates into more retail spending on Black Friday. But the serious point is that it’s easy to produce extremely strong correlations with women in STEM statistics that have no place in causal reasoning because good theory would not support such explanations.
3. Did the cause precede the effect? The need for longitudinal design
One strength that Tyler Vigen’s Women in STEM spurious correlations (above) have, which Stoet and Geary’s correlation does not, is that they are longitudinal. If Stoet and Geary wanted to assess the effect of GGGI measures on the percentage of STEM tertiary degrees awarded to women in a given nation, then they should have used a longitudinal design. Not only is the design not longitudinal, but, even more concerning, the outcome measure (% of STEM tertiary degrees awarded to women) is measured from 2012-2015, yet the treatment (GGGI) is measured in 2015. If the authors posit that greater gender equality causes lower STEM participation for women, then it is inappropriate to use a measurement of STEM participation that occurs prior to the measurement of gender equity.
Causal reasoning with Stoet and Geary’s data would require repeated yearly measures of gender equity considered in relation to yearly rates of STEM tertiary degrees awarded to women. For example, in Lithuania the percentage of STEM tertiary degrees awarded to women starts at 16.8% in 1999, but in 2015 it is 11.32%. Unfortunately, while there is yearly data starting in 2006 for the set of countries included in the GGGI, the current data available through UNESCO is missing data on STEM for many years for most of the countries, meaning that this dataset is inadequate to use for this type of inquiry.
4. Testing the sensitivity of findings to data, measures, and assumptions
In our Commentary, we evaluated whether the correlation posited by Stoet and Geary is robust to assumptions about how to measure gender equality and achievement of women in STEM. While confirmation of their findings would not confirm the causal mechanism relating gender equity to women’s pursuit of STEM degrees, it would provide additional evidence that the association was robust.
Our approach was to reanalyze the results, changing the measure of gender equity from the GGGI to the Basic Index of Gender Inequality (BIGI). The BIGI was developed by Stoet and Geary (Stoet and Geary, 2019) with the intention of including outcomes that can be favorable or unfavorable to both men and women and not just unfavorable to women. Instead of using their measure of women’s achievement in STEM, we used the percentage of women among tertiary STEM graduates as reported by UNESCO. Finally, we included all countries with available BIGI and UNESCO STEM data for the year 2015 (n = 77) rather than limiting the analysis to countries with PISA data (n = 52).
A two-tailed bivariate Spearman correlation analysis to assess the relationship between the BIGI and the percentage of women among STEM graduates revealed that the correlation was not significant, rs = -0.075, p = 0.518 (Fig. 1). We then restricted our analysis to the 45 countries for which BIGI and Program for International Student Assessment (PISA) data are available. We did this because in the original Stoet and Geary paper, the authors considered countries which had both GGGI and PISA data available. The correlation remained statistically insignifcant, rs = 0.070, p = 0.647. Our results suggest Stoet and Geary’s findings are not robust to changes in design and measurement. Analysis of the relationship between BIGI and Stoet and Geary’s propensity measure yielded a significant correlation of rs = 0.266, p = 0.021, but this correlation became nonsignificant when restricted to PISA countries (rs = 0.240, p = 0.117).

Fig. 1. Scatterplot showing the relationship between the Basic Index of Gender Inequality (Stoet & Geary, 2019) and the percentage of women among all tertiary graduates in STEM from the UNESCO 2015 dataset. The correlation is non-significant (rs = -0.075, p = 0.518).
5. But what can this tell us about individual choices, anyway? The Ecological Fallacy and the Gender Equality Paradox hypothesis
Finally, Stoet and Geary’s reasoning exemplifies the ecological fallacy, a subtler but damaging methodological error. The ecological fallacy occurs when conclusions about the traits of individuals are made from group-level data. The ecological fallacy was famously observed in sociologist Émile Durkheim’s 1951 study showing a positive correlation between suicide rates in Prussian counties and the proportion of Protestants in those counties, concluding that Protestants had a higher proclivity toward suicide. Durkheim used group-level data to infer individual-level conclusions about Protestants. Yet it is possible that in the counties with the highest rates of Protestants, non-Protestants were committing suicide, as later described by Hal Morgenstern (Morgenstern, 1995). The point is that using the rate of suicide at the county-level tells you nothing about who is committing suicide within the county. Had Durkheim wanted to evaluate whether Protestants are actually more likely to commit suicide, he should have collected individual-level data for Protestants and non-Protestants and calculated the rate of suicide within both groups.
Similarly, Stoet and Geary correlate percentage of STEM tertiary degrees awarded to women with GGGI (both group level variables) and make individual-level claims regarding women’s preferences. In other words, even if higher GGGI did cause lower STEM participation on a national level (though we refute this claim elsewhere), this relationship tells us nothing about whether individual women who experience greater gender equity are more or less likely to pursue STEM education.
Conclusion
This post has focused on how Stoet and Geary use numbers to make inferences about the relationship between women’s STEM preferences and gender equality. The methodological shortcomings described question the legitimacy of the correlations Stoet and Geary report. While we believe it is important to analyze and ultimately understand how gender equity influences women and their career preferences, non-rigorous empirical analyses can often result in spurious relationships.
Our Psychological Science Commentary didn’t stop with the statistical monkey business problems, however. We also grapple with the conceptual framework for measuring gender equality and engaging in cross-national comparisons of science field preferences. This is the subject we take up next.
Authorship Statement:
This blog series on the Gender Equality Paradox emerged from collective GenderSci Lab discussions. Each author outlined and drafted their own piece. GenderSci Lab members offered comments and authors integrated these revisions. Brianna Weir developed original artwork for the series. Maria Charles authored and approved the final version of her interview answers and provided images and figures for our use. Tyler Vigen developed a “women in STEM” spurious correlations widget for us and provided permission for the use of his findings in this blog series. Juanis Becerra and Nicole Noll assisted with formatting the blogs for the website. Heather Shattuck-Heidorn oversaw the blog series development, review, and publishing process. For the Psychological Science paper, Sarah Richardson drafted the manuscript. Meredith Reiches and Joe Bruch performed the data analysis. All authors (Richardson, Reiches, Bruch, Boulicault, Noll, and Shattuck-Heidorn) provided critical revisions and approved the final version of the manuscript for submission. Action editor Tim Pleskac shepherded the Corrigendum and Commentary through the peer review process at Psychological Science. We thank the anonymous peer reviewers and Gijsbert Stoet and David Geary for their contributions.
Recommended Citation:
Richardson, Sarah S. and Bruch, Joe. “Gender Equality Paradox Monkey Business: Or, How to Tell Spurious Causal Stories about Nation-Level Achievement by Women in STEM,” GenderSci Blog, February 12, 2020, https://genderscilab.org/blog/gender-equality-paradox-monkey-business-or-how-to-tell-spurious-causal-stories-about-nation-level-achievement-by-women-in-stem
Endnotes:
Durkheim E. 1951. Suicide: A Study in Sociology, pp. 153-54. New York: Free Press
Morgenstern, H. (1995). Ecologic studies in epidemiology: concepts, principles, and methods. Annual review of public health, 16(1), 61-81. DOI: 10.1146/annurev.pu.16.050195.000425
Stoet G, Geary DC (2019) A simplified approach to measuring national gender inequality. PLoS ONE 14(1): e0205349. https://doi.org/10.1371/journal.pone.0205349